


GridSynergy
Intelligent, energy consumption controller application
Intelligent, energy consumption controller application
GridSynergy
Intelligent, energy consumption controller application
Intelligent, energy consumption controller application
GridSynergy
Intelligent, energy consumption controller application
Intelligent, energy consumption controller application
Introduction
GridSynergy Software learns a facility’s energy use patterns and responds automatically to peaks in demand by directing the battery to store and discharge capacity. Cloud-based Software serves three primary functions:
Controls the GridSynergy Storage.
Provides a portal for the consumers to view their savings and revenues.
Allows remote monitoring and analysis by the Green Charge professional services team.
As a control system, GridSynergy relies on the analysis of thousands of sites to calculate the optimal charge and discharge cycles. As the system learns site-specific load profiles, its predictive algorithm adjusts second by second to maximize savings for the consumers.
Introduction
GridSynergy Software learns a facility’s energy use patterns and responds automatically to peaks in demand by directing the battery to store and discharge capacity. Cloud-based Software serves three primary functions:
Controls the GridSynergy Storage.
Provides a portal for the consumers to view their savings and revenues.
Allows remote monitoring and analysis by the Green Charge professional services team.
As a control system, GridSynergy relies on the analysis of thousands of sites to calculate the optimal charge and discharge cycles. As the system learns site-specific load profiles, its predictive algorithm adjusts second by second to maximize savings for the consumers.
What We Did...
We have established: underlying UI architecture, information design, visual language and aesthetic direction. Created a coherent set of Data Visualization components. Passed HTML, CSS, JS prototypes along with Visual / Interaction Design Specifications
We have established: underlying UI architecture, information design, visual language and aesthetic direction. Created a coherent set of Data Visualization components. Passed HTML, CSS, JS prototypes along with Visual / Interaction Design Specifications
What We Did...
We have established: underlying UI architecture, information design, visual language and aesthetic direction. Created a coherent set of Data Visualization components. Passed HTML, CSS, JS prototypes along with Visual / Interaction Design Specifications
What We Did...
We have established: underlying UI architecture, information design, visual language and aesthetic direction. Created a coherent set of Data Visualization components. Passed HTML, CSS, JS prototypes along with Visual / Interaction Design Specifications
We have established: underlying UI architecture, information design, visual language and aesthetic direction. Created a coherent set of Data Visualization components. Passed HTML, CSS, JS prototypes along with Visual / Interaction Design Specifications

Logotype “Green Leaf” concept.
The application is helping us to save our environment by optimizing our energy consumption. Yet it is a “High-Tech” product, a semi autonomous, intelligent solution.
The application is helping us to save our environment by optimizing our energy consumption. Yet it is a “High-Tech” product, a semi autonomous, intelligent solution.
Goals
Goals
Goals
Primarily goal was to design & implement an easy-to-understand UI navigation pattern. Design a responsive UI Layout to enable the use of Large Ultra HD TV screens to handheld tablets. Generate a modern, competitive visual design. Clear information design, UI layout / Navigation design, Data Visualization.
Primarily goal was to design & implement an easy-to-understand UI navigation pattern. Design a responsive UI Layout to enable the use of Large Ultra HD TV screens to handheld tablets. Generate a modern, competitive visual design. Clear information design, UI layout / Navigation design, Data Visualization.
Design Topics
Design Topics
Design Topics
Handling High Data Density
How to enable the app UI structure to equally handle one single tenant and a network of consumers?
How to visualize the overall performance of multiple versus single station data?
What information is more important from the perspective of overall performance versus one single station's data?
How to enable the app UI structure to equally handle one single tenant and a network of consumers?
How to visualize the overall performance of multiple versus single station data?
What information is more important from the perspective of overall performance versus one single station's data?
Handling High Data Density
How to enable the app UI structure to equally handle one single tenant and a network of consumers?
How to visualize the overall performance of multiple versus single station data?
What information is more important from the perspective of overall performance versus one single station's data?
Data Visualization Screens EV Station Data and EV Station Overview
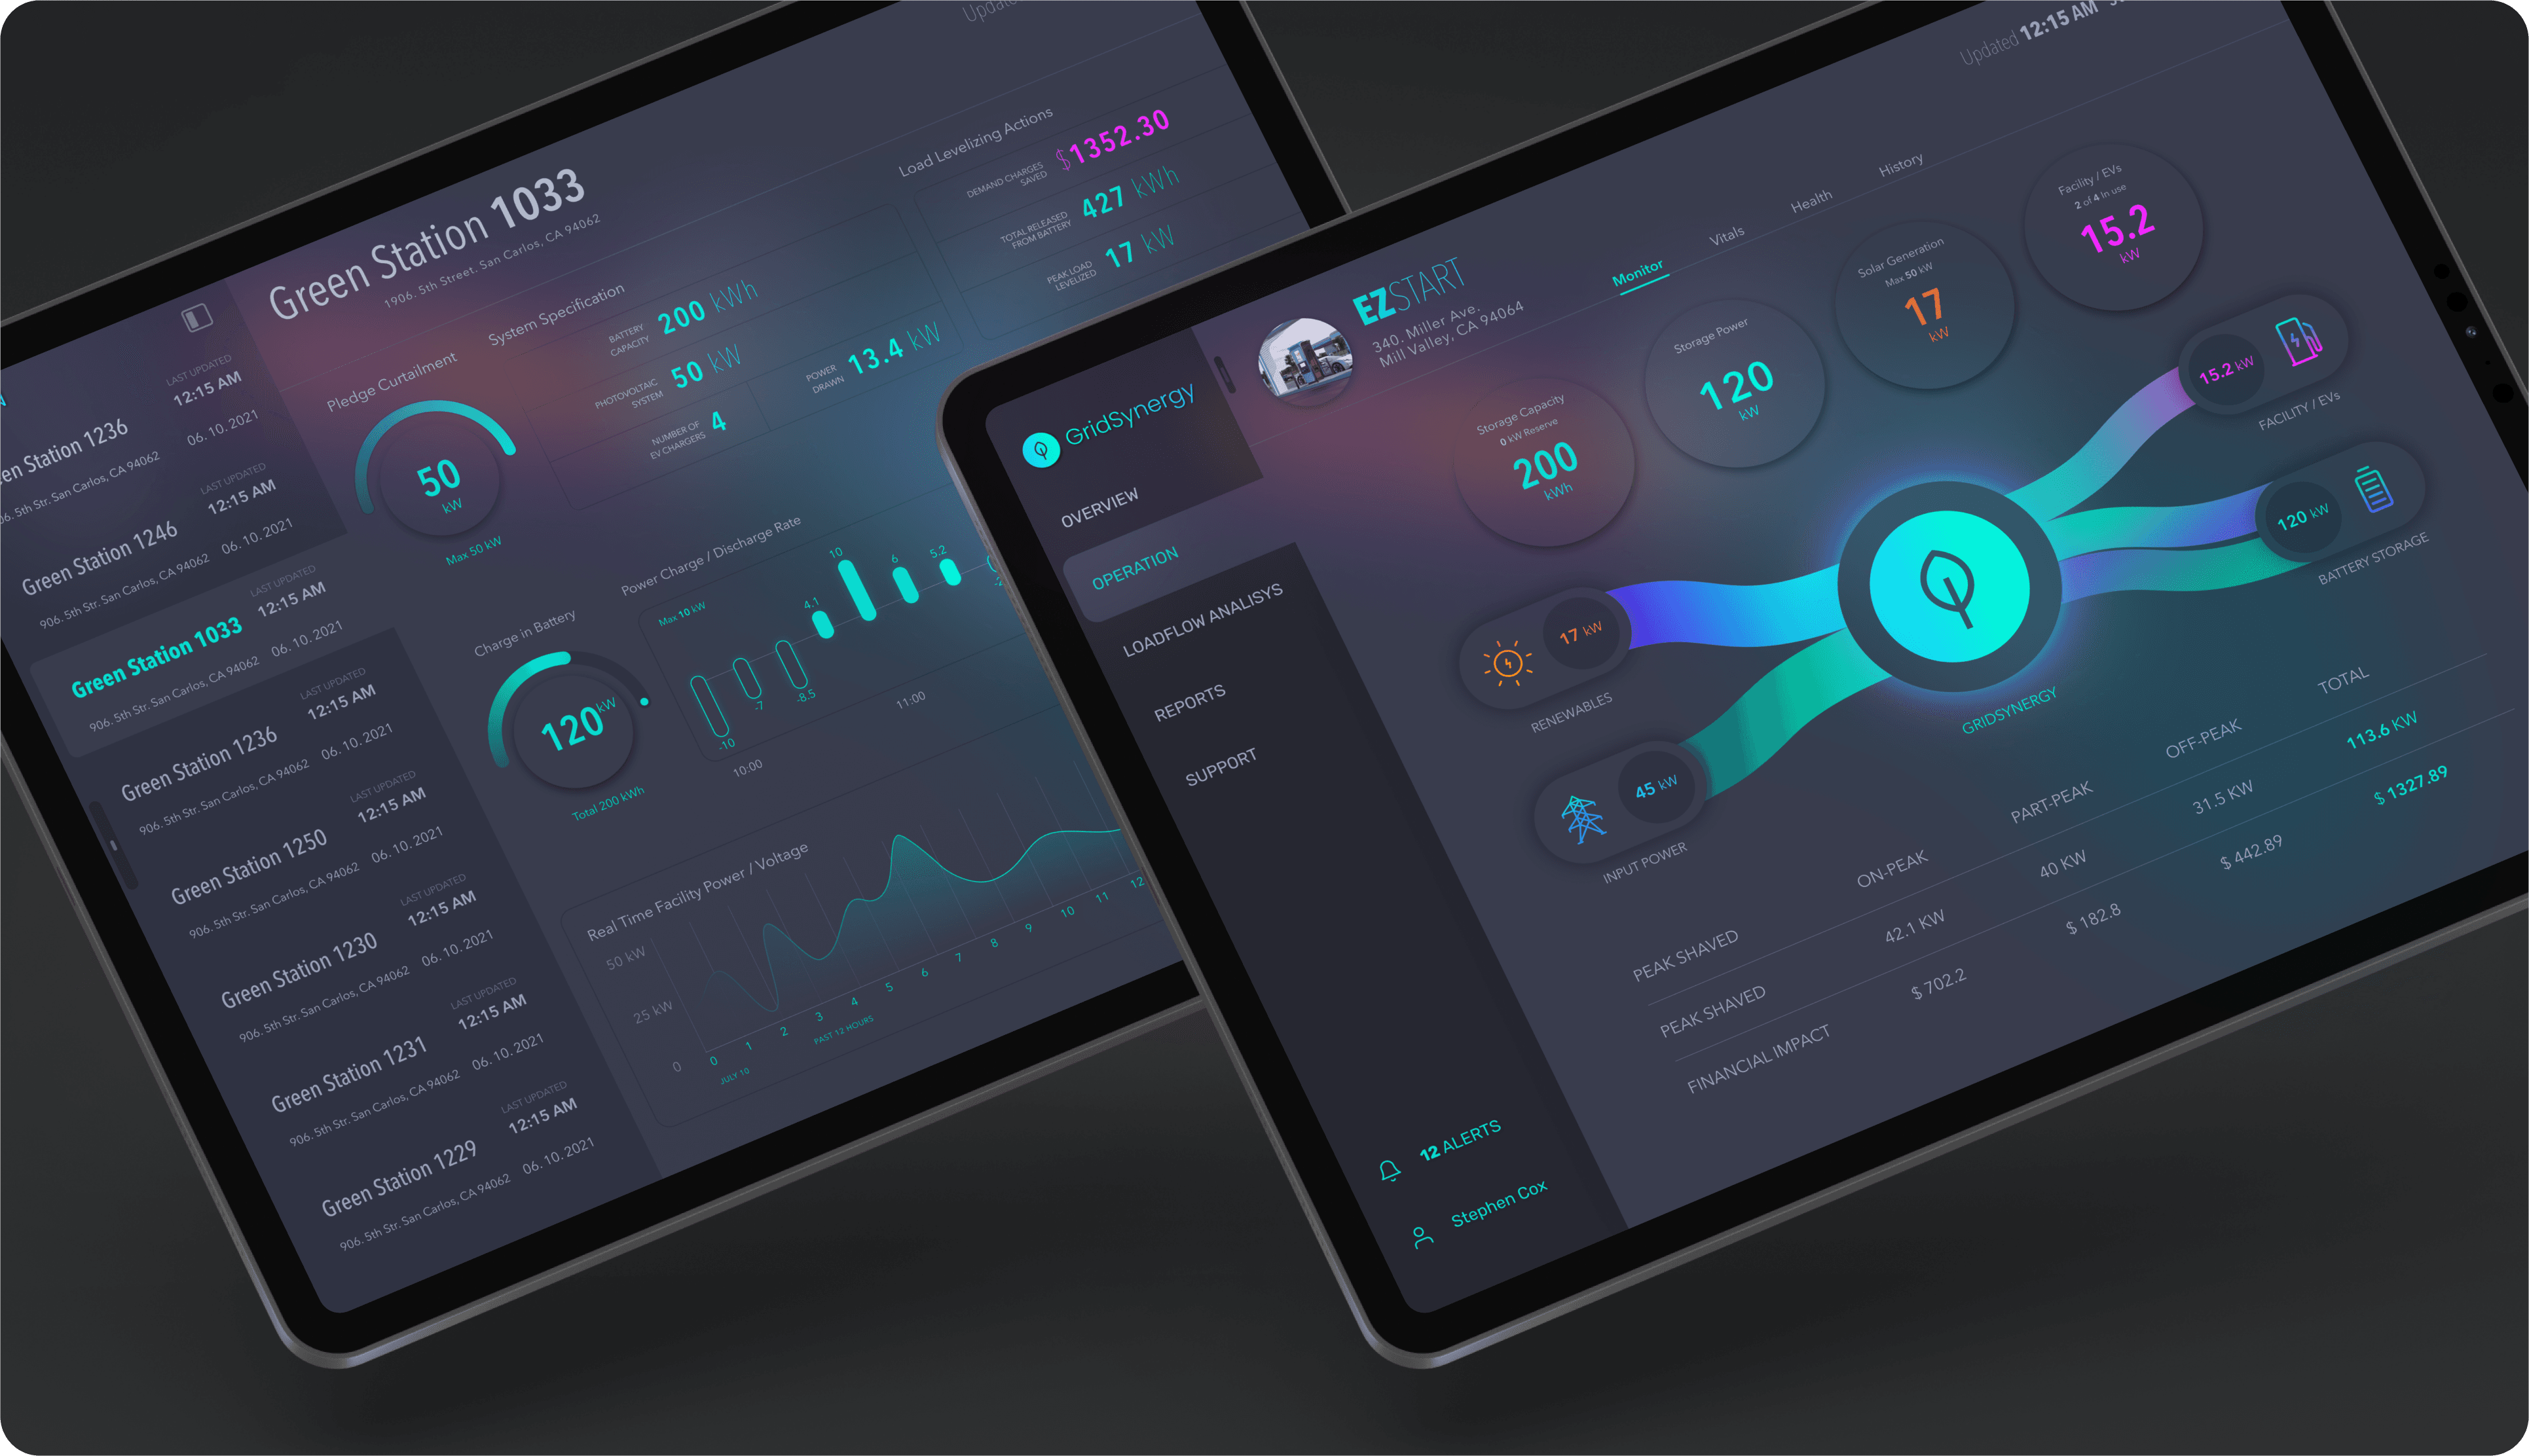
Cross platform UI geometry enables for large UHD and touch screen devices

EV Station Operation Overview Page on Laptop and tablet

EV Station performance data on large screen, UHD display
Single facility - EV Charger Station, Performance Overview
Overview performance indicators in relation to input/output, savings on shaved off-peak consumption.
Overview performance indicators in relation to input/output, savings on shaved off-peak consumption.
Single facility - EV Charger Station, Performance Overview
Overview performance indicators in relation to input/output, savings on shaved off-peak consumption.
Single facility - EV Charger Station, Performance Overview
Overview performance indicators in relation to input/output, savings on shaved off-peak consumption.

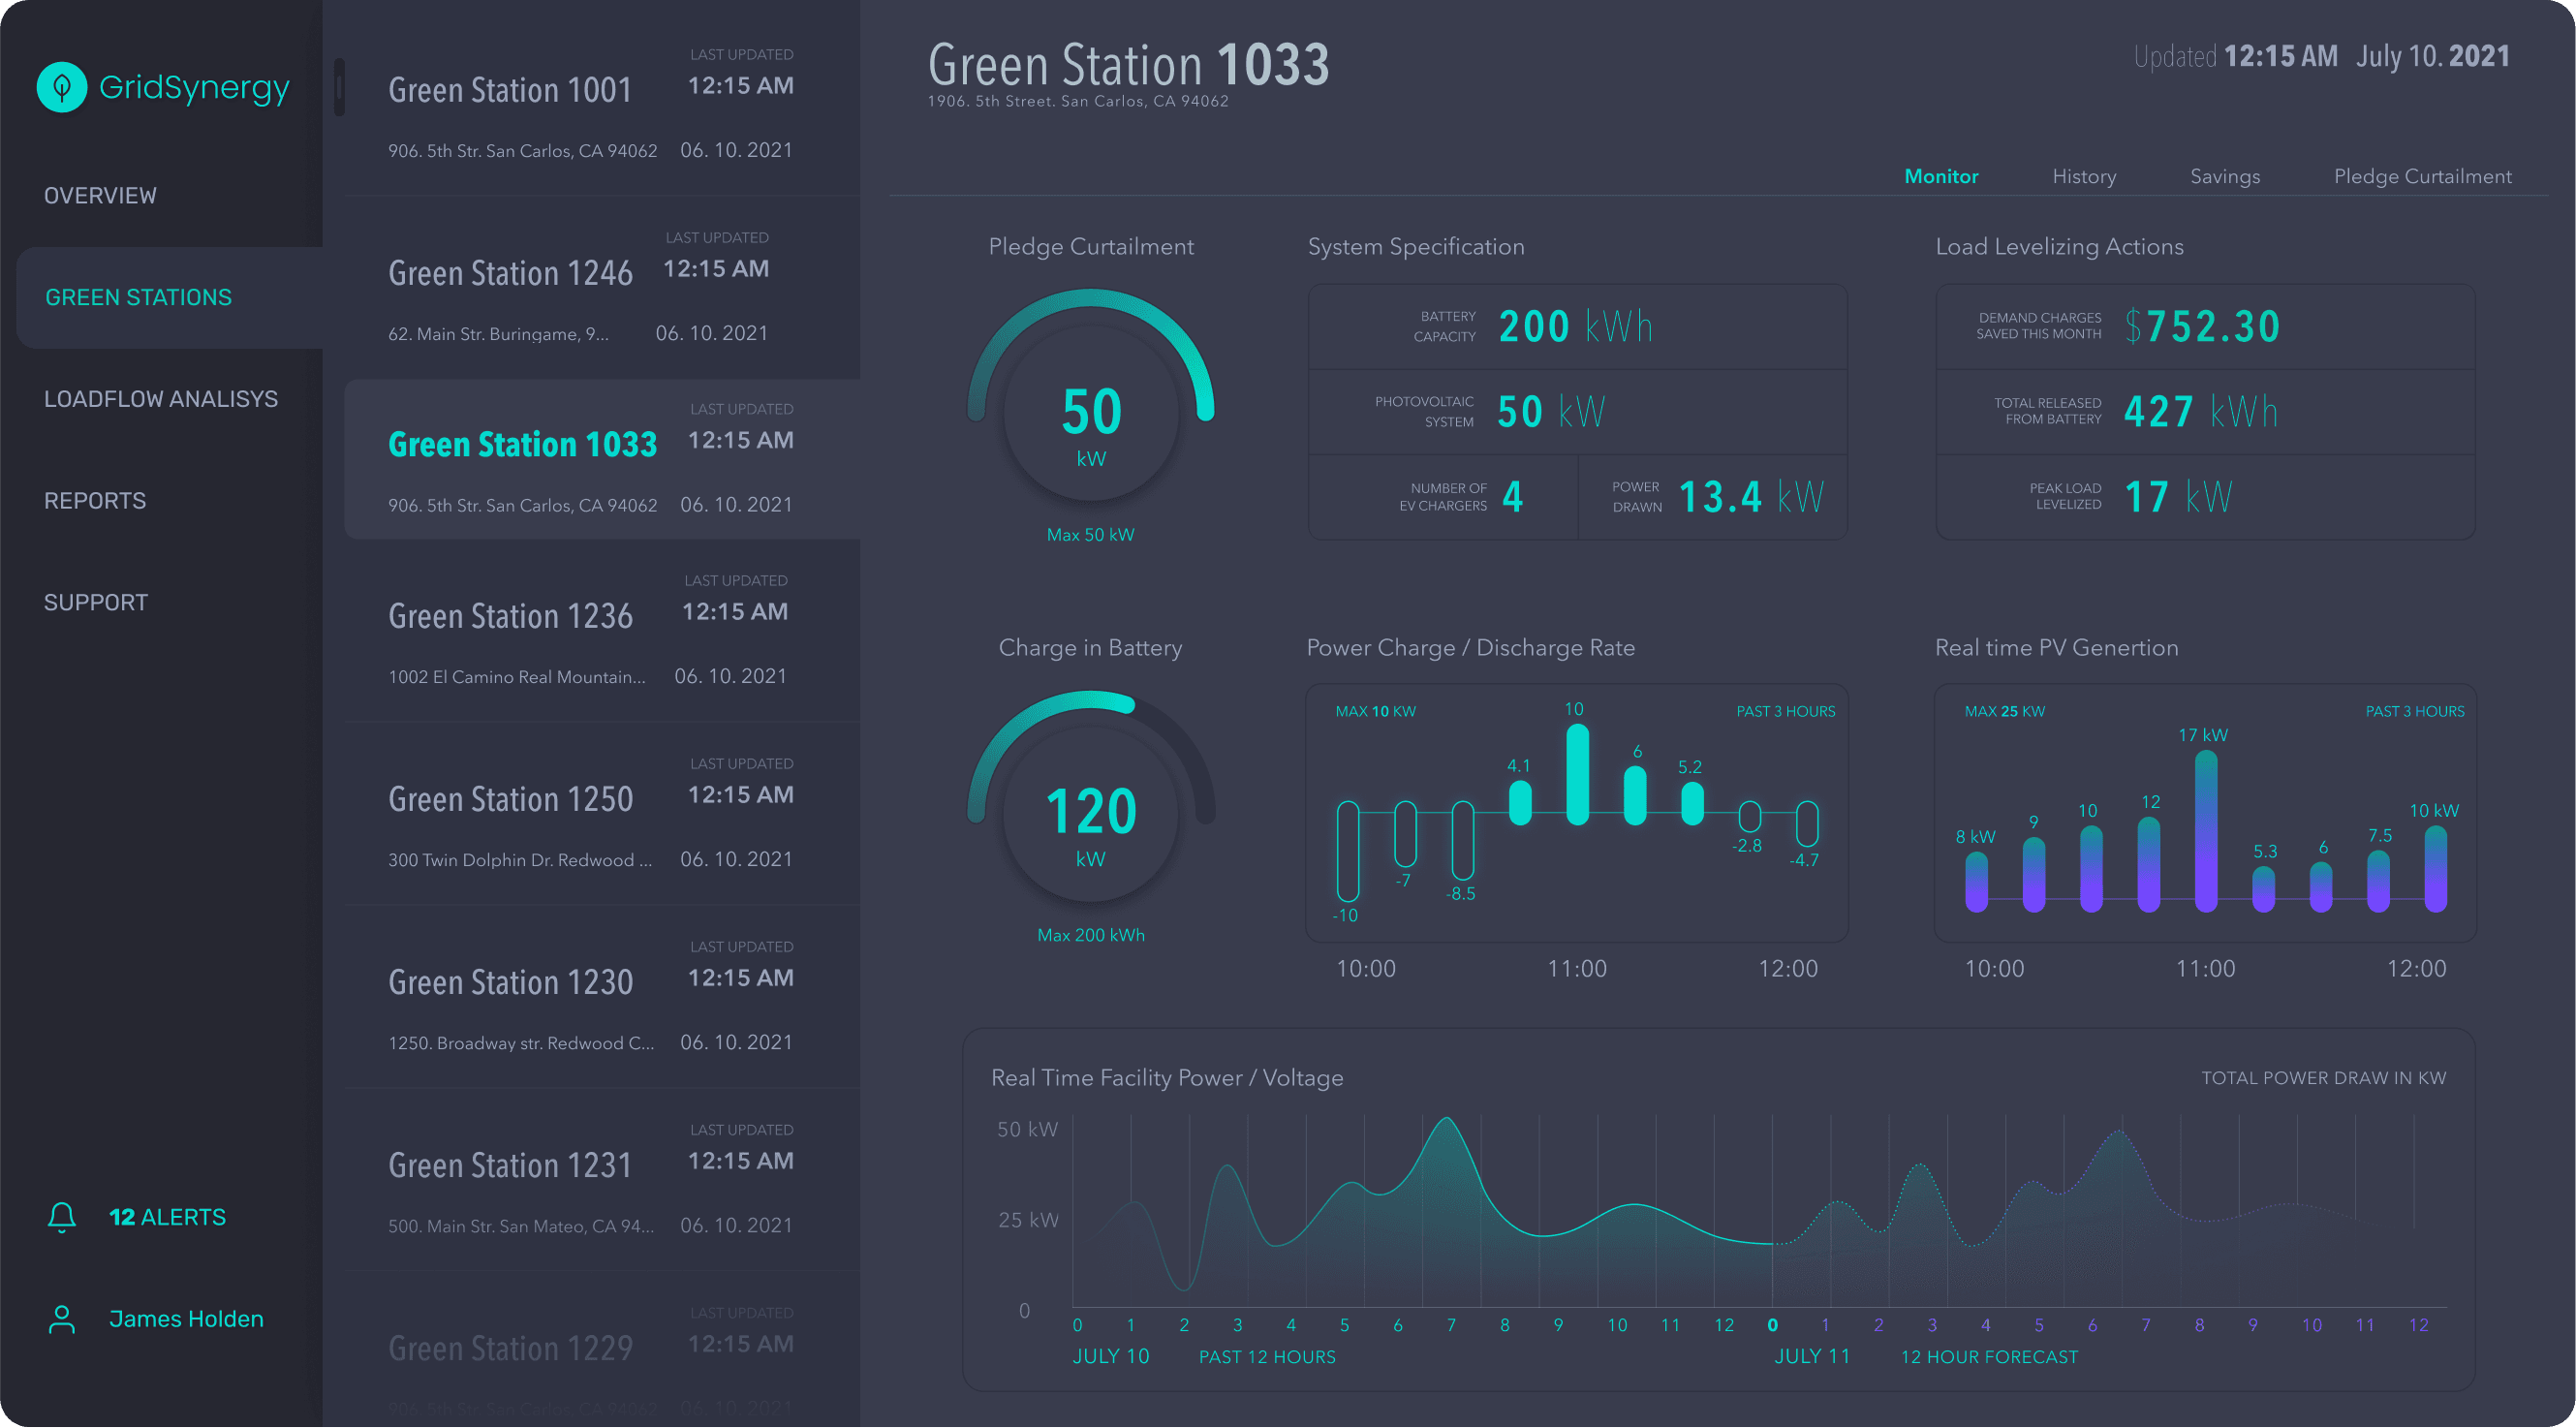
EV Charger Station network, Station’s Consumption Data
Application Status / Performance Overview Screen
Application Status / Performance Overview Screen
EV Charger Station network, Station’s Consumption Data
Application Status / Performance Overview Screen
EV Charger Station network, Station’s Consumption Data
Application Status / Performance Overview Screen
hi@zizo.design
ZIZO.DESIGN ©2022 All Rights Reserved
hi@zizo.design
ZIZO.DESIGN ©2022 All Rights Reserved
hi@zizo.design
ZIZO.DESIGN ©2022 All Rights Reserved